


DOT Price (Polkadot) Jumps 10%, Why Bulls Can Pump It To $12
Polkadot (DOT) is gaining pace above the $10.00 resistance against the US Dollar. The price could extend its rally toward the $12.00 level in the near term. DOT is gaining pace above the $9.80 and $10.00 levels against the US Dollar. The price is trading above the $10.00 zone and the 100 simple moving average (4 hours). There is a key bullish trend line forming with support at $9.10 on the 4-hour chart of the DOT/USD pair (data source from Kraken). The pair could continue to rise toward the $12 resistance zone. Polkadot Price Resumes Rally After forming a base above the $8.00 level, DOT price started a fresh rally. It gained over 20% in a few days and even outperformed Ethereum and Bitcoin at times. There was a clear move above the $9.50 and $10.00 resistance levels. The price traded to a new multi-month high at $11.00 and is currently consolidating gains. There was a minor pullback below the $10.75 level. The price is still above the 23.6% Fib retracement level of the upward move from the $8.26 swing low to the $11.00 high. DOT is now trading well above the $10.00 zone and the 100 simple moving average (4 hours). There is also a key bullish trend line forming with support at $9.10 on the 4-hour chart of the DOT/USD pair. The trend line is close to the 61.8% Fib retracement level of the upward move from the $8.26 swing low to the $11.00 high. Source: DOTUSD on TradingView.com Immediate resistance is near the $10.75 level. The next major resistance is near $11.00. A successful break above $11.00 could start another strong rally. In the stated case, the price could easily rally toward $12.00 in the near term. The next major resistance is seen near the $13.50 zone. Are Dips Supported in DOT? If DOT price fails to start a fresh increase above $11.00, it could start a downside correction. The first key support is near the $10.35 level. The next major support is near the $10.00 level, below which the price might decline to $9.50. Any more losses may perhaps open the doors for a move toward the $9.20 support zone or the trend line. Technical Indicators 4-Hours MACD – The MACD for DOT/USD is now gaining momentum in the bullish zone. 4-Hours RSI (Relative Strength Index) – The RSI for DOT/USD is now above the 50 level. Major Support Levels – $10.35, $10.00 and $9.50. Major Resistance Levels – $10.75, $11.00, and $12.00.

Polkadot (DOT) is gaining pace above the $10.00 resistance against the US Dollar. The price could extend its rally toward the $12.00 level in the near term.
- DOT is gaining pace above the $9.80 and $10.00 levels against the US Dollar.
- The price is trading above the $10.00 zone and the 100 simple moving average (4 hours).
- There is a key bullish trend line forming with support at $9.10 on the 4-hour chart of the DOT/USD pair (data source from Kraken).
- The pair could continue to rise toward the $12 resistance zone.
Polkadot Price Resumes Rally
After forming a base above the $8.00 level, DOT price started a fresh rally. It gained over 20% in a few days and even outperformed Ethereum and Bitcoin at times.
There was a clear move above the $9.50 and $10.00 resistance levels. The price traded to a new multi-month high at $11.00 and is currently consolidating gains. There was a minor pullback below the $10.75 level. The price is still above the 23.6% Fib retracement level of the upward move from the $8.26 swing low to the $11.00 high.
DOT is now trading well above the $10.00 zone and the 100 simple moving average (4 hours). There is also a key bullish trend line forming with support at $9.10 on the 4-hour chart of the DOT/USD pair. The trend line is close to the 61.8% Fib retracement level of the upward move from the $8.26 swing low to the $11.00 high.
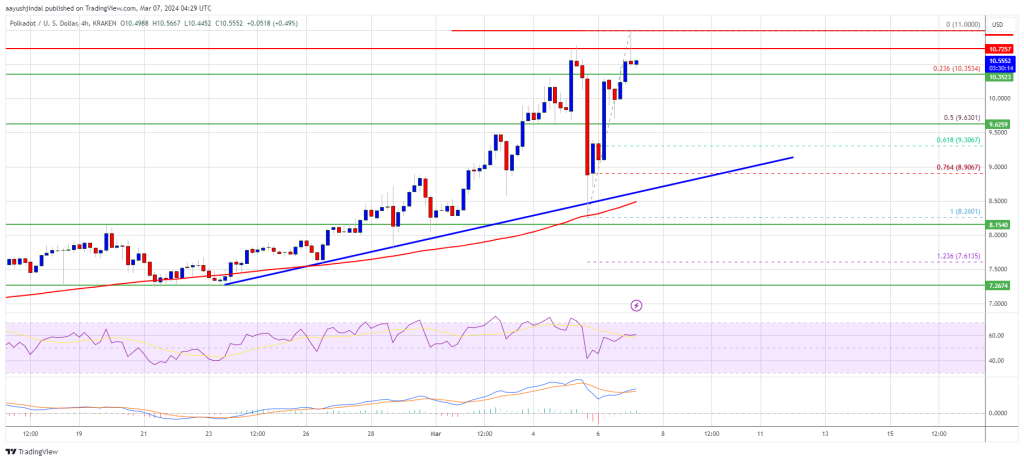
Source: DOTUSD on TradingView.com
Immediate resistance is near the $10.75 level. The next major resistance is near $11.00. A successful break above $11.00 could start another strong rally. In the stated case, the price could easily rally toward $12.00 in the near term. The next major resistance is seen near the $13.50 zone.
Are Dips Supported in DOT?
If DOT price fails to start a fresh increase above $11.00, it could start a downside correction. The first key support is near the $10.35 level.
The next major support is near the $10.00 level, below which the price might decline to $9.50. Any more losses may perhaps open the doors for a move toward the $9.20 support zone or the trend line.
Technical Indicators
4-Hours MACD – The MACD for DOT/USD is now gaining momentum in the bullish zone.
4-Hours RSI (Relative Strength Index) – The RSI for DOT/USD is now above the 50 level.
Major Support Levels – $10.35, $10.00 and $9.50.
Major Resistance Levels – $10.75, $11.00, and $12.00.
What's Your Reaction?