


SOL Price Breaks $150 – Why Solana Could Soon Test $180
Solana is gaining bullish momentum above $150. SOL price is showing positive signs, and it could even surpass the $162 resistance in the near term. SOL price started a fresh increase from the $138 support against the US Dollar. The price is now trading above $150 and the 100 simple moving average (4 hours). There is a connecting bullish trend line forming with support at $140 on the 4-hour chart of the SOL/USD pair (data source from Kraken). The pair could continue to rally if it clears the $156 and $162 resistance levels. Solana Price Starts Fresh Rally Solana price formed a base above the $130 support zone and recently started a fresh increase. There was a decent increase above the $135 and $145 levels. The price is up nearly 10% and there was a move above the $150 level, like Bitcoin and Ethereum. The bulls pushed the price above the 76.4% Fib retracement level of the downward move from the $152.86 swing high to the $137.25 low. Solana is now trading above $150 and the 100 simple moving average (4 hours). There is also a connecting bullish trend line forming with support at $140 on the 4-hour chart of the SOL/USD pair. Source: SOLUSD on TradingView.com Immediate resistance is near the $156.50 level. The next major resistance is near the $162.50 level or the 1.618 Fib extension level of the downward move from the $152.86 swing high to the $137.25 low. A successful close above the $162.50 resistance could set the pace for another major increase. The next key resistance is near $175. Any more gains might send the price toward the $180 level. Are Dips Limited in SOL? If SOL fails to rally above the $162.50 resistance, it could start a downside correction. Initial support on the downside is near the $150 level. The first major support is near the $142.00 level, below which the price could test $138.00 and the trend line. If there is a close below the $138.00 support, the price could decline toward the $128.00 support or the 100 simple moving average (4 hours) in the near term. Technical Indicators 4-Hours MACD – The MACD for SOL/USD is gaining pace in the bullish zone. 4-Hours RSI (Relative Strength Index) – The RSI for SOL/USD is above the 50 level. Major Support Levels – $152.80, and $162.50. Major Resistance Levels – $150, $142, and $138.

Solana is gaining bullish momentum above $150. SOL price is showing positive signs, and it could even surpass the $162 resistance in the near term.
- SOL price started a fresh increase from the $138 support against the US Dollar.
- The price is now trading above $150 and the 100 simple moving average (4 hours).
- There is a connecting bullish trend line forming with support at $140 on the 4-hour chart of the SOL/USD pair (data source from Kraken).
- The pair could continue to rally if it clears the $156 and $162 resistance levels.
Solana Price Starts Fresh Rally
Solana price formed a base above the $130 support zone and recently started a fresh increase. There was a decent increase above the $135 and $145 levels.
The price is up nearly 10% and there was a move above the $150 level, like Bitcoin and Ethereum. The bulls pushed the price above the 76.4% Fib retracement level of the downward move from the $152.86 swing high to the $137.25 low.
Solana is now trading above $150 and the 100 simple moving average (4 hours). There is also a connecting bullish trend line forming with support at $140 on the 4-hour chart of the SOL/USD pair.
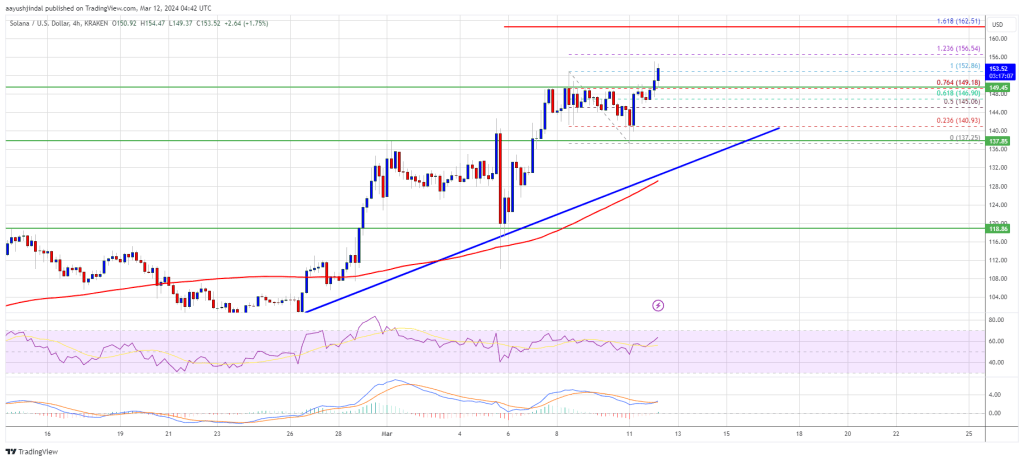
Source: SOLUSD on TradingView.com
Immediate resistance is near the $156.50 level. The next major resistance is near the $162.50 level or the 1.618 Fib extension level of the downward move from the $152.86 swing high to the $137.25 low. A successful close above the $162.50 resistance could set the pace for another major increase. The next key resistance is near $175. Any more gains might send the price toward the $180 level.
Are Dips Limited in SOL?
If SOL fails to rally above the $162.50 resistance, it could start a downside correction. Initial support on the downside is near the $150 level.
The first major support is near the $142.00 level, below which the price could test $138.00 and the trend line. If there is a close below the $138.00 support, the price could decline toward the $128.00 support or the 100 simple moving average (4 hours) in the near term.
Technical Indicators
4-Hours MACD – The MACD for SOL/USD is gaining pace in the bullish zone.
4-Hours RSI (Relative Strength Index) – The RSI for SOL/USD is above the 50 level.
Major Support Levels – $152.80, and $162.50.
Major Resistance Levels – $150, $142, and $138.
What's Your Reaction?